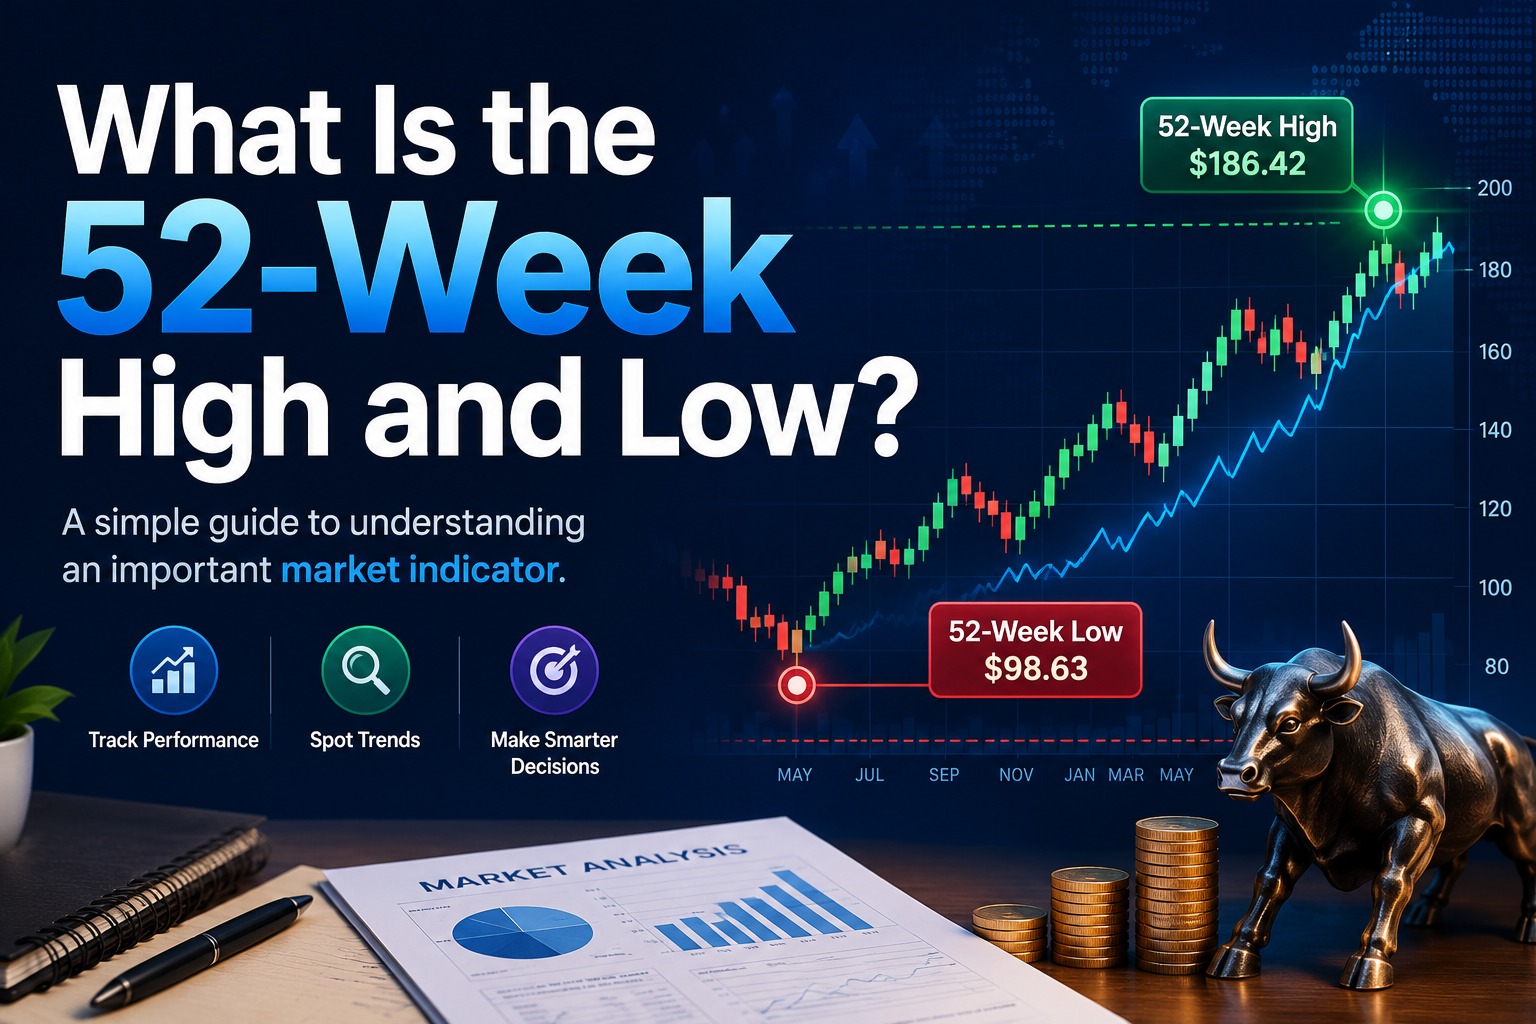
If you have ever looked up a stock on Yahoo Finance or Google Finance, you have probably noticed a line that says something like “52-Week Range: $195.07 – $317.40.” It is right there on the page, sitting next to the stock price, but most beginner investors scroll right past it without knowing what it means or why it matters.
The 52-week high and low is one of the simplest yet most useful data points in stock investing. It tells you the price boundaries a stock has traded within over the past year, and understanding it can help you make smarter decisions about when to buy, sell, or simply wait.
In this guide, we will explain exactly what the 52-week high and low means, show you how it works with real examples from the U.S. stock market, and answer the question every investor eventually asks: should I buy a stock near its 52-week high, or wait until it drops to its low?
What Does 52-Week High and Low Mean?
The 52-week high is the highest price a stock has reached during the past 52 weeks (roughly one year). The 52-week low is the lowest price it has traded at during that same period.
A few important details that many explanations leave out:
It is a rolling window, not a calendar year. If today is June 17, 2026, the 52-week range covers June 17, 2025 through June 17, 2026. It moves forward every single trading day, which means the high and low can change at any time.
It is based on closing prices in most cases. A stock might spike to $200 during the trading day (intraday high) but close at $195. Most financial platforms use the closing price to determine the official 52-week high, though some include intraday prices. Always check which method your data source uses.
It resets automatically. If a stock hit its 52-week low 11 months ago and has been climbing since, that low will eventually drop out of the 52-week window as time passes. The range is always evolving.
How Is the 52-Week Range Calculated?
There is no complex formula involved. The calculation is straightforward:
Look at every closing price for a stock over the past 252 trading days (which is roughly 52 weeks). The highest closing price becomes the 52-week high. The lowest closing price becomes the 52-week low.
Here is a simple example. Imagine a stock called XYZ Corp that traded between $40 and $75 over the past year. Its 52-week range would be $40 – $75. If XYZ is currently trading at $60, you can immediately see that it is sitting closer to the middle of its yearly range, roughly equidistant from its high and low.
This range is sometimes expressed as a percentage. In this case, XYZ is trading at about 57% of the way between its low and high, which some investors call the “52-week range position.”
Real Examples From the U.S. Stock Market
Theory is useful, but real numbers make the concept stick. Let us look at the actual 52-week ranges for two of the most widely followed stocks in the U.S. market.
Apple Inc. (AAPL)
As of mid-June 2026, Apple’s 52-week range is $195.07 – $317.40. That is a significant spread. The stock hit its 52-week low of $195.07 in June 2025 and climbed to a high of $317.40 by June 2026, representing a roughly 63% move from low to high.
What does this tell an investor? It shows that Apple experienced substantial price movement over the past year. If you are looking at Apple’s current price relative to this range, you can quickly assess whether it is trading near the top of its yearly range (potentially signaling strong momentum) or closer to the bottom (potentially signaling weakness or a buying opportunity, depending on the reason for the decline).
NVIDIA Corporation (NVDA)
NVIDIA’s 52-week range as of mid-June 2026 stands at $142.03 – $236.54. The spread between the high and low is about 67%, reflecting the kind of volatility that AI-related stocks have experienced in recent years.
An investor looking at NVIDIA can see at a glance that the stock has had a wide trading range over the past year. If NVIDIA is currently trading near $210, it is closer to the upper end of its 52-week range, which suggests it has been trending upward. But it is still below its 52-week high, which raises the question: is there room to run, or is it approaching resistance?
What You Can Learn From These Examples
Notice how different the ranges are for each stock. Apple’s range spans about $122, while NVIDIA’s spans about $94. But in percentage terms, NVIDIA’s range is actually wider. This tells you something about each stock’s volatility. Higher volatility means bigger potential gains but also bigger potential losses.
You can find the 52-week range for any U.S. stock on platforms like Yahoo Finance, Google Finance, MarketWatch, or your brokerage account. It is usually displayed right on the stock’s summary page.
How Do Investors Use the 52-Week High and Low?
The 52-week high and low is not just a piece of trivia. Investors and traders use it in several practical ways:
Identifying Support and Resistance Levels
The 52-week low often acts as a support level, meaning the price tends to stop falling around that point because buyers step in, seeing it as a bargain. The 52-week high often acts as a resistance level, meaning the price struggles to break above it because sellers take profits.
These are not guarantees. Support and resistance levels can and do break. But they serve as useful reference points for setting buy orders, sell orders, and stop-loss levels.
Spotting Trends
A stock that keeps setting new 52-week highs is likely in a strong uptrend. This can signal that the company is performing well, that investor sentiment is positive, or that the broader market is bullish. On the other hand, a stock repeatedly hitting new 52-week lows may be in a downtrend, which could reflect poor earnings, negative news, or sector-wide challenges.
Gauging Volatility
The spread between the 52-week high and low gives you a quick sense of how volatile a stock is. A narrow range (say, $45 – $55) suggests the stock is relatively stable. A wide range (say, $80 – $200) tells you the stock has experienced significant price swings, and you should be prepared for continued volatility if you invest in it.
Anchoring Valuation
Some investors use the 52-week range as a rough valuation anchor. If a fundamentally strong company’s stock is trading near its 52-week low due to a temporary setback (not a permanent decline in business quality), it might represent a value opportunity. This approach is common among value investors who follow the principles of buying undervalued assets.
Should You Buy a Stock Near Its 52-Week High?
This is one of the most common questions beginner investors ask, and the honest answer is: it depends.
The case for buying near a 52-week high: Stocks that reach new highs often continue to climb. This is called momentum investing. The logic is simple: a stock does not reach its highest price in a year by accident. Something is driving it, whether that is strong earnings, a new product, or favorable market conditions. If those drivers are still in place, the stock may continue to rise and set even higher highs. Research has shown that stocks breaking through their 52-week highs tend to outperform in the short term.
The case for caution: Buying at or near the peak means there is less margin of safety. If the stock reverses, you are the person who bought at the highest price in a year. Additionally, stocks near their highs sometimes attract profit-taking, where investors who bought earlier decide to sell and lock in their gains. This selling pressure can push the price down, at least temporarily.
The practical takeaway: Never buy or avoid a stock solely because it is near its 52-week high. Instead, look at the reason behind the price movement. Is the company growing revenue? Did it beat earnings expectations? Is the entire sector doing well? If the fundamentals support the price, a 52-week high might just be a stepping stone to even higher prices. If the price is driven purely by hype or speculation, caution is warranted.
Should You Buy a Stock at Its 52-Week Low?
The flipside of the same question, and equally nuanced.
The case for buying at a 52-week low: Value investors love stocks near their 52-week lows. The reasoning is that if a company’s business is fundamentally sound but its stock price has dropped due to temporary factors (a bad quarter, market-wide panic, negative headlines that do not affect long-term prospects), then buying at the low could be a bargain. You are essentially buying the same company for a lower price.
The case for caution: There is a well-known investing phrase: “Don’t try to catch a falling knife.” A stock at its 52-week low might be there for a very good reason. Maybe the company is losing money, facing lawsuits, or operating in a declining industry. In those cases, the stock is not cheap — it is appropriately priced for a business in trouble, and it could go even lower.
The practical takeaway: A 52-week low is a signal to investigate, not an automatic buy signal. Ask yourself why the stock is at its low. Read the latest earnings reports. Check if there has been any major news. If the drop is due to temporary, fixable issues and the company’s core business remains strong, it could be an opportunity. If the drop reflects a genuine deterioration in the company’s prospects, stay away.
Limitations of the 52-Week High and Low
The 52-week range is a useful tool, but it has real limitations that every investor should understand:
It is backward-looking. The 52-week high and low tell you where a stock has been, not where it is going. Past performance does not predict future results. A stock that went from $50 to $100 last year could just as easily go from $100 to $60 this year.
It ignores context. A stock might be at its 52-week low because the entire market crashed, not because anything is wrong with the company. Similarly, a stock might be at its 52-week high because of a market-wide rally, not because the company itself is doing anything special. Always consider the broader market environment.
It should not be used in isolation. The 52-week range is one data point among many. Combine it with fundamental analysis (revenue, earnings, debt levels) and other technical indicators (moving averages, volume, RSI) to get a more complete picture. No single metric should drive your investment decisions.
It can create psychological traps. Investors sometimes anchor too strongly to the 52-week high, thinking “the stock was $200 before, so it should get back there.” This is not always true. The previous high might have been driven by conditions that no longer exist.
The Bottom Line
The 52-week high and low is a simple but powerful reference point that tells you the price range a stock has traded within over the past year. It helps you quickly assess a stock’s momentum, volatility, and where its current price sits relative to its recent history.
But remember: it is a starting point for research, not a conclusion. The smartest investors use the 52-week range alongside earnings data, financial ratios, industry trends, and their own investment goals to make informed decisions.
Now that you understand the 52-week high and low, you might want to explore some related concepts that will deepen your understanding of stock analysis:
- P/E Ratio — How to tell if a stock is expensive or cheap relative to its earnings
- Market Capitalization — How to understand the size of a company
- EPS (Earnings Per Share) — The profit metric behind every stock price
This article is for informational and educational purposes only. It does not constitute investment advice. Always conduct your own research and consult with a qualified financial advisor before making any investment decisions.